Time and Tide…
A big high tide - looking across the beach towards First Terrace from Second Terrace:
Sunderland is isolated by the tide twice a day at certain times of the lunar month.
The tide is the rise and fall of the sea level roughly every 12 hours.
In most places around the UK there are two tides each day. The sea level rises to a maximum, called 'high water' and then falls to a minimum level - 'low water'.
When the tide is rising it is said to 'Flow' and when falling it is said to 'Ebb'. We often talk about the ebb and flow of events, to mark the passage of time.
At Sunderland Point the tide is very noticeable because the river estuary and salt-flats fill and empty as the level of the water changes.
The graph below shows the sea-level at Heysham during the day of 2 August 2022

Water level during the day of 2 August 2022
The heights (shown on the vertical axis to the left) are measured from 'Chart Datum'. This is the 'zero' level used on sailors' navigational charts. It is the level of the Lowest Astronomical Tide (LAT). (The average level of the lowest tide recorded over a long period)
The time of day is shown on the horizontal axis starting at midnight (00:00). There are two high water times and two low water times each day.
Tidal Range
The difference in height between the high tide and the low tide is called the Tidal Range. At Sunderland Point the biggest tidal range is about 9m (29ft).
The biggest tidal range in the UK is found in the Severn Estuary where it is about 15m (49ft)
The tidal range on the coast is affected by the shape of the coastline in that area.
River estuaries cause a funnelling effect which increases the range. Straight coastlines tend to have smaller ranges. In mid -ocean the tidal range is about 0.6m (2ft).
Origin of the Tides
The tides are caused by the combined gravitational attraction of the earth, moon and the sun.
The moon has the larger influence because it is very much closer to the earth than the sun. However the sun also has a small effect. The gravitational forces create a bulge in the level of the oceans on each side of the earth roughly opposite to the moon's position in its orbit.
The Moon orbits the earth and at the same time the Moon and Earth together orbit the sun.
It takes 29.5 days for the moon to come back to the same position with respect to the Sun. This is called the Synodic Month or, commonly, the Lunar Month.
The Lunar Month is usually taken to start at the time of a New Moon. At this time the Moon is between the Earth and the Sun and we can't see it. It rises and sets with the sun, and the sun's light gets in our eyes, but the moon is still there.
Because the moon and the sun are aligned, they have a large combined gravitational effect on the oceans and a large tidal bulge is produced. This is the time of a Spring Tide:

Sun, Moon and East are aligned at the start of the Lunar Month
About 7.4 days later, the moon has moved a quarter of the way around in its orbit. The sun's and the moon's influence do not act together, so the tidal bulge is smaller. The Moon is a half moon rising after the sun in the late morning. This is the time of a Neap tide:

First Quarter
About 14.75 days after the new moon is a full moon. The moon is now at the opposite side to the sun in its orbit. The tidal bulge is big again because the moon and the sun are aligned. Again we get another Spring tide.

Full Moon - Second spring tide in the month
About 22 days into the lunar month the moon is now three-quarters of the way round its orbit. The is the next Neap tide.

Third Quarter - Second Neap tide in the month
Springs and Neaps
The size of the tidal bulge depends on the relative positions of the Moon, in its orbit around the earth, and the Sun.
The biggest gravitational effect occurs when the sun and moon and earth are aligned. This is the time of Spring tides when the tidal range is largest. For us on the surface of the earth, this is when there is a New moon or a Full moon.
If the earth and the sun are at right angles the tidal bulge is smallest and this creates the Neap tides. At this time we see a Half moon.
The diagram below shows the variation of the tidal range over a period of about 30 days. The red line shows the high tide levels. The blue line shows the low tide levels for each day.

Tidal Range varies during each Lunar Month
A Month on Second Terrace
Below are photos of the Neap and Spring tides on 7 and 15 August 2022 in front of the houses on Second Terrace at Sunderland Point.
The pictures were taken from the same observation point to allow comparison of the water levels.

A month in the life of Second Terrace - Photos courtesy of Lynne Levey
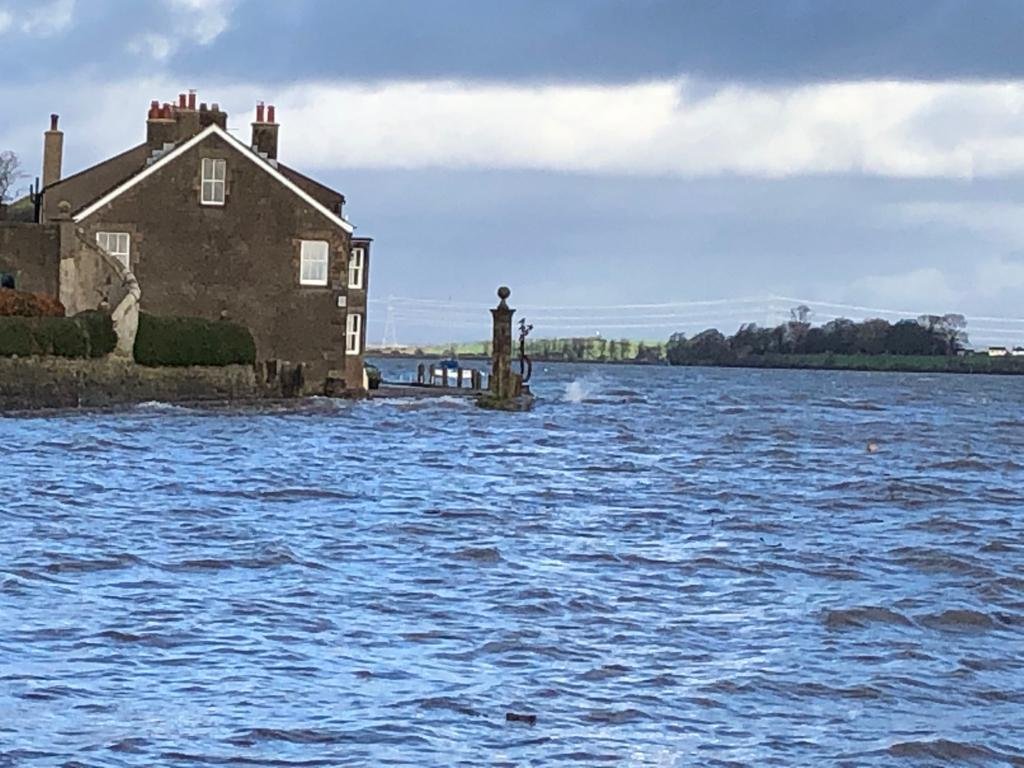
A bit of a blow!
Here’s a scene from a recent storm at Second Terrace:

Tide overtops sea-wall at Second Terrace - Photo courtesy of Lynne Levey
Can it get any worse?

Let’s skip going to ASDA! - Photo courtesy of Lynne Levey
Yes!
Next week we shall publish an article on the Mystery of the Mission Church photograph.

From the collection of Wilton Atkinson